
The Election Cycle – What to Expect in Stocks & Bond Prices
By: Chris Vermeulen – www.TheGoldAndOilGuy.com
It is that time in the presidential cycle that gets everyone emotional and concerned with the future outlook of the United States. While everyone has their opinion on whom they think is best for America, I promised myself a long time ago to keep my thoughts to myself for two key reasons. ONE: only 50% of Americans will agree with me J, and TWO: I am Canadian so I do not experience what Americans go through on a daily basis.
My thinking is if Obama wins then we will see Quantitative Easing continue. And with the recent positive economic numbers on Friday it should give some confidence to investors that things are SLOWLY stabilizing (Bullish for Stocks). But, if Romney wins then we could see Quantitative Easing be cut or eliminated which is obviously bad for equities.
So, let’s just jump into the charts of what I feel will unfold in the next few days and months.
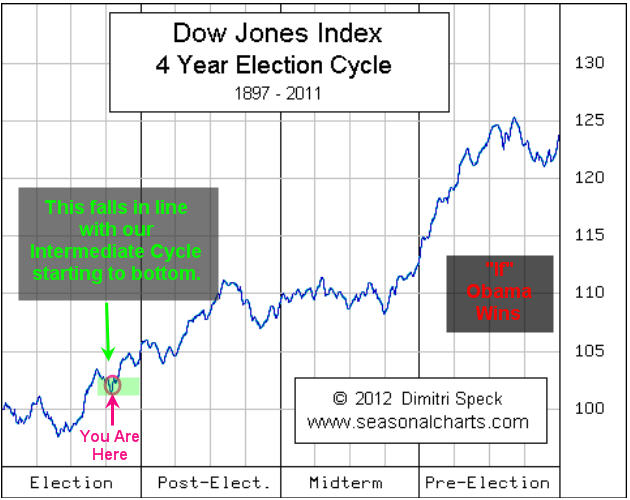
Using the season chart of the four year election cycle we can see what the Dow Jones Index has done in past election periods. Obviously every market environment is drastically different in each situation but overall we see stronger stock price. This is naturally a very emotional time for investors but once the election is finished most individuals become more confident simply because there is a leader that has four years to make things better and there is nothing they can do about it now and the campaigning and debating is over.
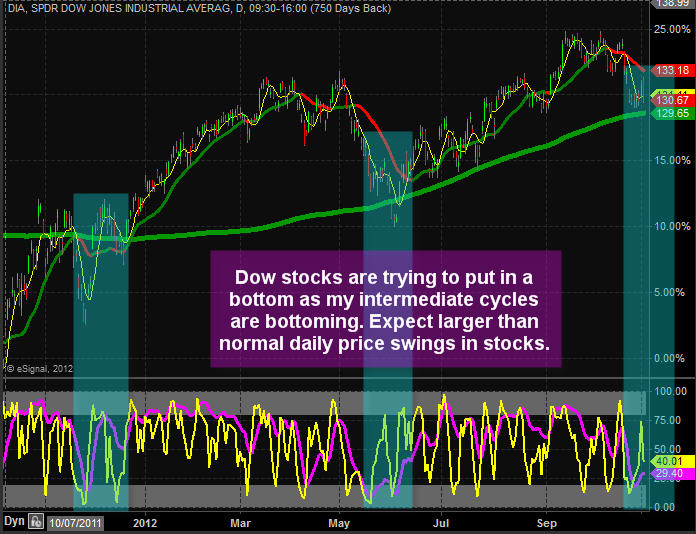
DIA – Dow Jones Industrial Average – Daily Chart:
Looking at the chart of Dow DIA Index fund you can see a 5-6 month cycle in the market which has a positive skew. Just so you understand what a positive skew is I will explain.
Positive Skew is when the market is trending up making a series of higher highs and higher lows. Because there are naturally more buyers during a bull market each cycle upswing lasts longer then when the cycle down downswing. So you get longer rallies which sends your secondary indicators (stochastics, volatility, put/call ratios, advance decline line etc…) in the overbought levels for extended periods of time. Those trying to pick a top continually get their head handed to them. The focus must be on buying the pullbacks. Keep in mind volatility is higher which meaning risk per trade is higher. Overall in the long run you stand a much higher chance of making money trading with the trend than trying counter trend trades (picking a top).
So as you can see below it looks like the stock market will be trying to put in the bottom over the next week or two which falls in line with our election cycle. It is very important to know that during intermediate cycle lows is where some of the biggest drops take place. These sharp drops are what is needed to cleanse the market one last time to shake as many traders with tight stops out of the market before it reverses and starts the next rally. I would like to see a 1-3 day market sell off as that would be the signature bottoming pattern I like to buy.
Bond Prices – Moving Against the Norm…
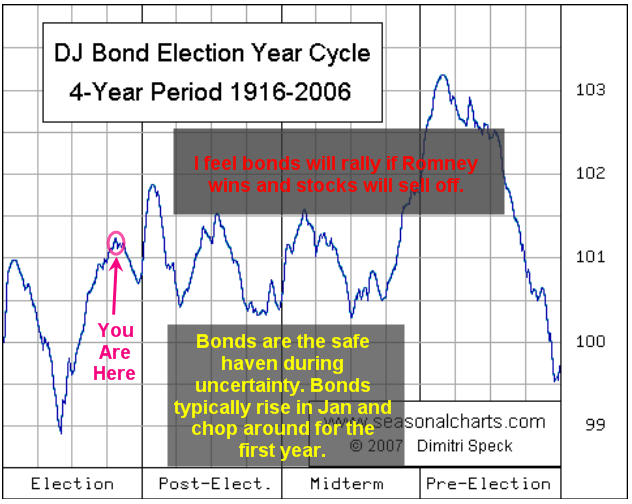
Bond investors are some of the most conservative people in the market. They do not like to take risks so they dump their money into bonds to make a tiny profit in exchange for low risk (volatility). The nature of these investors put more money into bonds as we enter the election because they are nervous about not knowing who will be in control of the country.
After the election finished some money flows out of bonds and into stocks because there is now a president and direction for the country. Generally come the new year investors move to bonds as the safe haven as they try to figure out what their game plan is for new year.
So looking forward to this week and the next 2 months I would not be surprised to see bond prices rise or trade sideways while stocks move higher. This analysis is based on Obama winning. If Romney wins then I feel bonds will rally much more and stocks could sell off.
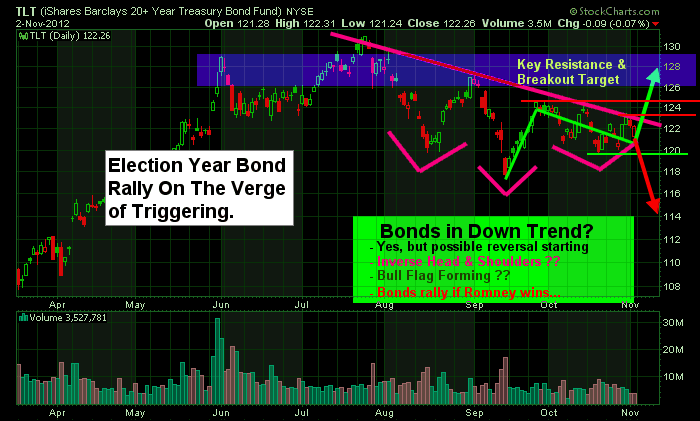
TLT Bond Exchange Traded Fund – Daily Chart:
Here is a chart of 20+ year bonds showing a possible reversal to the upside that could trigger as soon as next week. This chart is forward looking 1 – 2 weeks. Overall the trend remains down but if Romney wins I feel bonds breakout above the red resistance levels and trigger a new uptrend. You can follow my stock charts and ETF charts live every day here: http://stockcharts.com/public/1992897
Election Year Trading Cycle Conclusion:
Next week is going to be very interesting to watch unfold. I generally do not like to trade or invest before news of this magnitude so trade smaller sizes if you do as price action could be wild.
Get my Daily Trading Analysis & Trade Setups at: www.TheGoldAndOilGuy.com
Chris Vermeulen
Add to SocialTrade
Disclaimer:
This material should not be considered investment advice. Technical Traders Ltd. and its staff are not a registered investment advisors. Under no circumstances should any content from this website, articles, videos, seminars or emails from Technical Traders Ltd. or its affiliates be used or interpreted as a recommendation to buy or sell any type of security or commodity contract. Our advice is not tailored to the needs of any subscriber so go talk with your investment advisor before making trading decisions This information is for educational purposes only.