
The Logical Fear Trade – Emotions vs. Analysis & Logic
I apologize now for the Christmas colored charts below… Its a lot of red and green but these are the most understood colors for knowing what ranges means (bullish or bearish).
This was a very emotion week for traders. The strong selling Thursday and Friday has traders and investors running for the door and panicking out of positions. While I did close out our long SP500 swing trading on Thursday to lock in a profitable trade, I do feel as though we can re-enter next week a better price.
The only ones feeling pain today are those who do not have enough self-discipline to create rules and trade by them. Again this is talked about in GREAT DETAIL in my new book. If this is you, I recommend buying my book and reading it this weekend as it’s a quick and simple read. There is a paperback version or instant PDF download available: Get Book.
Without self-discipline no amount of courses are trading services will make you a successful trader.
Let’s get technical and jump into the charts…
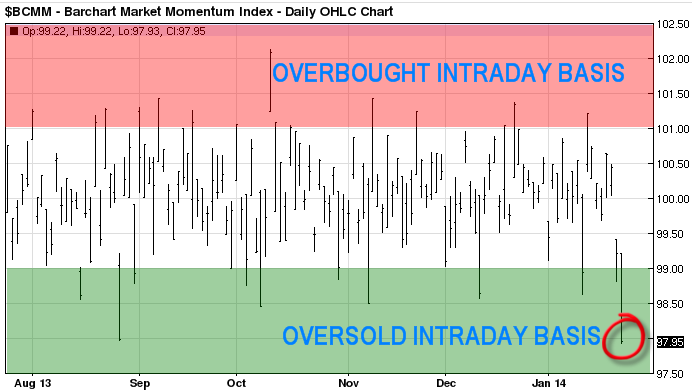
Momentum Index – The Intraday Extreme Overbought/sold indicator
This is an indicator I follow daily to understand how strong the selling is. If it is broad based or sector related. The last two sessions clearly shows is broad based and that the market has moved to quickly in one direction and is primed for a knee jerk reaction bounce.
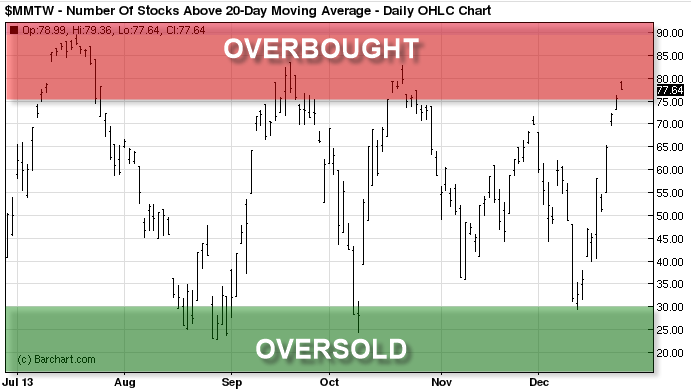
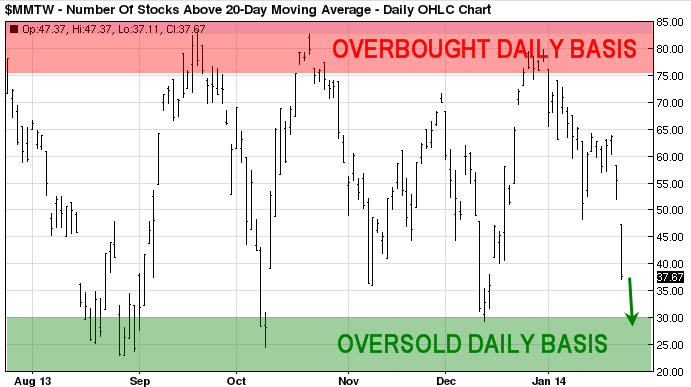
Swing Trading Cycles : 3-8 Weekly Overbought/Sold Market Cycles
This is a fantastic tool for timing key pivot lows and highs in the broad market. We are nearing another key pivot low but there is still room for more selling next week.
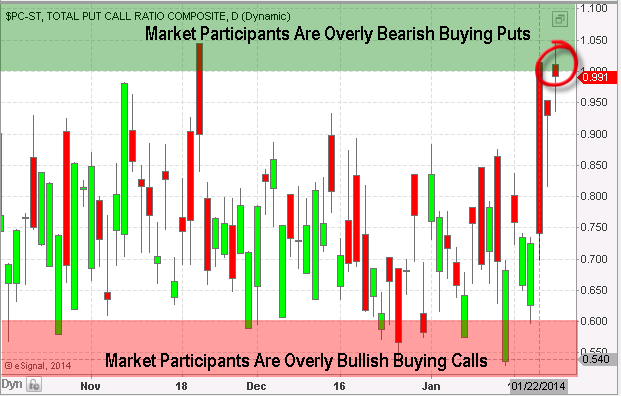
Options Traders Are Fearful of Continued Selling
If you don’t know what the put/call ratio is, in simple terms it tells us when the majority of traders are buying put options (expecting stocks to fall, ratio of 1.0+), and when they are overly bullish (expecting stocks to rise, ratio below 0.60).
The chart below shows everyone is leaning towards more selling in the stock market. I use this as a contrarian indicator.
The Fear Trade – Shorting Fear with an Instrument that Naturally Loses Value: VXX
There is a lot of interesting way to trade the stock market and once way it through shorting the VXX ETF during bull markets. Instead of buying a long position in stocks, you could simply short the VXX fund. This thing loses value over time because of the way it’s managed/constructed. So logic says, shorting it on bounces can be very rewarding during times when fear is high.
Keep in mind this fund and its underlying index moves FAST with 20-30% percent swings… Trade small position sizes if you ever touch this thing…
Weekly Technical Trading Report Conclusion:
In short, (pardon the pun) I feel the stock market is setting up for another big bounce. The technicals and longer term trend remains bullish. I trade with the trend until proven wrong. Only then will I change the direction and trade with the new trend.
Get These Reports Free Each Week: www.GoldAndOilGuy.com
Chris Vermeulen
Algorithmic Trader


