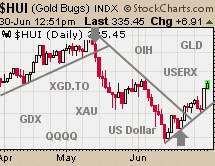
Bear Market is Bottoming, Equities VS Gold Bullion
Bearish Stock market looks like it has bottomed forming a similar pattern as it did in 2003. What is the better investment during an opportunity like this if this is the bottom: Stocks, Gold Bullion or Mining Stocks?
The charts below will really open your eyes as to how similar today’s W looking bottom is to the W shaped bottom in 2003. Of course 6 years later the markets trade and move faster than ever before because of technology allowing traders to track and trade stocks from anywhere with a click of a button. So this years bottom formed much quicker.
Traders, individual investors, hedge funds, financial institutions and even some of the guys on CNBC are starting to buy stocks and etfs (exchange traded funds) at these price levels. I remember the market bottom in 2003 and it was much similar to the type of energy buzzing these past few weeks. Of course there is a lot more drama with Obama as president, Printing US Dollars, Scandals and bad news hitting the market day after day. But what makes all this normal is that it cannot get much worse in the news and everyone is expecting it for months to follow. Traders and investors don’t even flinch when bad news comes out anymore and to top it off the SP500 has formed the same pattern it did during the last bear market bottom in 2003. Check out these charts below.
Performance Chart of SP500, Russell 2000, Gold Bullion and Gold Miner Stocks
This chart shows how well different investments performed during the last bull market. The SP500 was the steady gainer posting a 95% gain; Gold Miners Stocks posted a whopping 210% gain but had wild swings which were big enough to shake out even the best traders. Gold bullion and the Russell 2000 performed very well providing a 130% profit with manageable price swings.

The Market Bottom Pattern – 2003 & 2009 Compared
Take a look at these charts as I compare the current stock market bottom to what we saw in 2003. The charts are shown from the all time high before the bear market started.
Currently Bear Market Melt Down Pattern – 2008-2009

2002-2003 Bear Market Melt Down Pattern

Today’s SP500 Chart Pattern Feb 2

2003 SP500 Chart Pattern

Stock Market Bottom Pattern Conclusion:
As you can see from the charts above, it’s pretty amazing how similar things look between the two bear markets in the SP500. I don’t know if that’s what’s really interesting or the fact that both bear markets had the light volume Christmas Rally just before things reverse? Or that the bear market could end in the same month as it did last time? Either way I though this was worth pointing out to everyone.
I recommend you start thinking about putting some long term money to work giving it at least 4 years to mature. Today I started investing some long term money with some great looking Canadian ETFs for dividends, Growth and commodities. There are tones of ETFs in the USA for picking what you think will perform nicely during the next bull market.
If you would like to receive my free weekly market updates please enter your email address in the form below.
I look forward to hearing from you soon!
Chris Vermeulen
The Gold and Oil Guy
|