Over the next few years as debt, currencies and countries start to fall apart individuals will be looking to place their money where it will hold its value and buying power during times of extreme uncertainty.
If you eliminate fiat currencies which are created out of this air and are nothing more than a credit we are left with precious metals and stones. As much as we have evolved over time, we could be valuing things like gold, silver, platinum, and precious stones more so than our currency.
Let’s face it, currencies are swinging in value 20-50% regularly and while most people do not realize it their buying power often is not as strong as it was. Would you rather hold a large portion of your capital in say the EURO which is falling like a rock in value costing you thousands of dollars a month, or would gold and silver which rises in value as your currency falls be a smarter decision?
Do not get me wrong, I am not trying to be a doom and gloom analyst. And I hope to be wrong, but with so many things pointing to an extreme global change it only makes sense to add some protection in the event something drastic does happen. My new book explains how to protect your capital in detail.
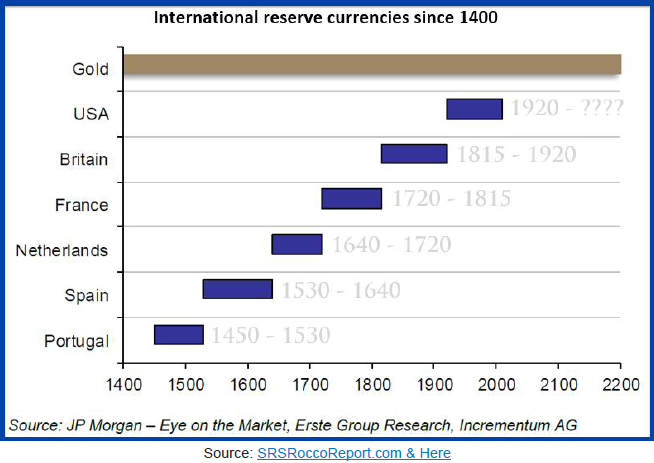
With the average fiat reserve currency since 1400 lasting between 80-105 years. With the dollar becoming the reserve currency in 1920 the odds point to the dollar being dropped within 3-5 years.
Gold Price Chart & Long Term Bullish Patterns
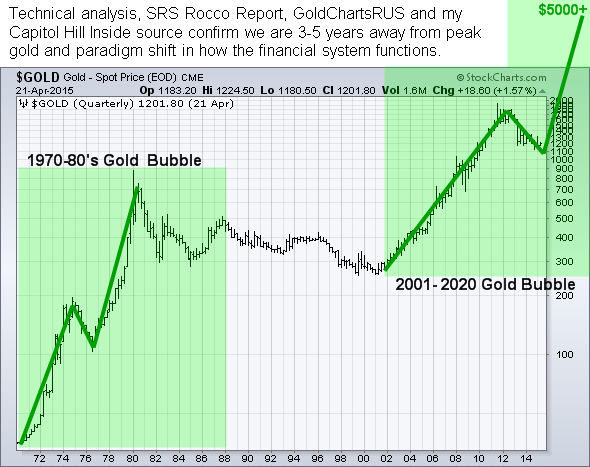
Review Of the 1970-80’s Gold & Bubble
The chart below shows the price of gold, silver, the typical price bubble, and phased of the market which happens in all asset types at some point in their life cycle.
The red line shows the average market participants emotional state. Yellow line is the price of gold, and the grey line in silver.
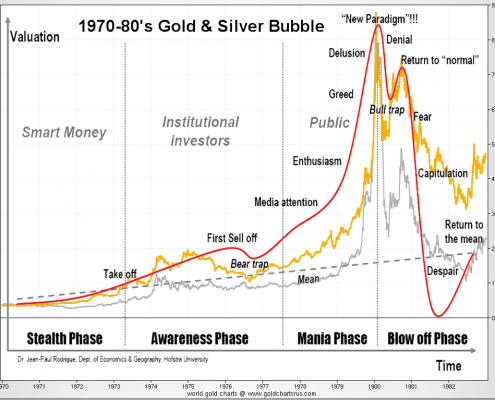 Source: SRS RoccoReport & GoldChartsrus.com
Current Gold & Silver Bubble – Priceless
The last bull market in precious metals will be dwarfed by the next one which I expect to start later this year. Over the next 3-5 years currencies, metals, stock market, new policies in the USA, etc… are likely to change more than we ever thought possible.
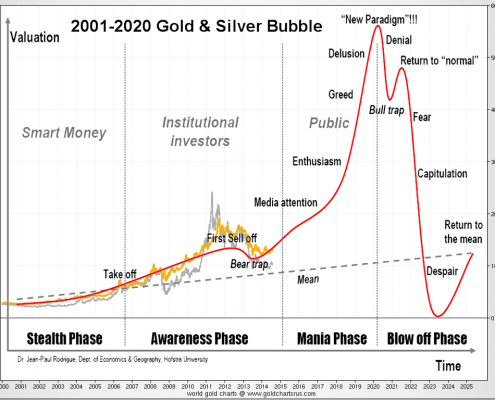
Source: SRS RoccoReport & GoldChartsrus.com
Priceless Gold Conclusion:
What does all this mean? It means money is going to move out of dying currencies and into physical assets like gold, and silver.
There are three different forecasting models for gold I have created. Depending how things play out in the next couple years the low target is $5,000 oz, and highest is $12,000 oz.
Starting to accumulate physical gold and silver as a long term investment and as insurance for your portfolio is critical. Small denominations are best because when prices sky rocket it will be tough to sell/trade a $12,000 oz gold bar compared to a gram of gold that will be worth $450, or better yet an ounce of silver worth $150.
With that said my key focus is on trading for income and growth through the use of exchange traded funds. And if precious metals are about to start another bull market there will be big gains in gold stocks which I will be trading.
Learn to trade, and get my trades live: www.TheGoldAndOilGuy.com
Chris Vermeulen