On April 12th I wrote a blog post titled Precious Metals Melt-Down, and How To Manage It. I talked about how gold, silver and gold mining stocks have been flying under the media radar for over a year and that they were not catching the attention of traders, investors and the public anymore. I also said it would take some sharp price action (breakdown or rally) for it to be front and center again on TV, Radio and Newspapers.
But since gold has plummeted 17.5% dropping from $1600 down to $1320 per ounce with silver and gold stocks falling also they are now headline news once again. This move has caused some serious damage to the charts when looking at it from a technical analysis point of view. Below are some basic analysis points that show a new swing trading entry point.
The Technical Traders Chart Analysis:
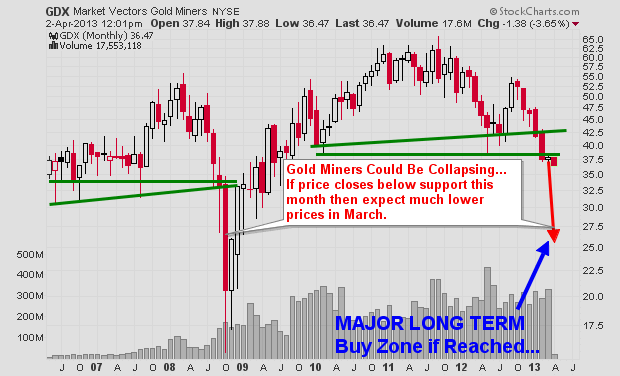
Broken Support – Once a support level has been broken it becomes resistance. Gold is trading under a major resistance level.
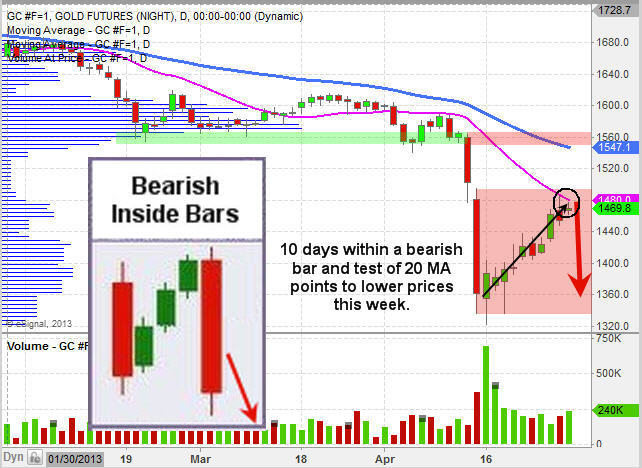
Momentum Bursts – Since the April 15th low, gold has been setting up for another short selling entry point. Remember the market tends to move in bursts of three, seven or ten days then price reverses direction or pauses. It has now been 10 days.
Moving Average Resistance – Gold has worked its way up to the 20 day moving average which can act as resistance.
Bearish Inside Bars – This type of chart pattern points to lower prices. When there is a big down day followed by 3, 7 or 10 up days inside the price action of the down bar we can typically expect another sharp drop which tests the recent lows as shown with the arrow on the chart.
Gold Short Selling Conclusion:
In short, gold is setting up for a low risk entry point that should allow us to profit from lower gold prices. Using an inverse ETF like DZZ or even the gold mining stock inverse ETF DUST could be played. These funds go up in value as the price of gold falls.
While I expect gold to pullback, I do not think it will make another leg lower. Instead, a test of the recent low or pierce of the low by a few bucks then reverse and start building a bullish basing pattern before going higher.
Get My Book Free and Learn How To Manage Your Trades, Money & Emotions: http://www.thegoldandoilguy.com/trade-money-emotions.php
Chris Vermeulen