By: Chris Vermeulen – www.TheGoldAndOilGuy.com

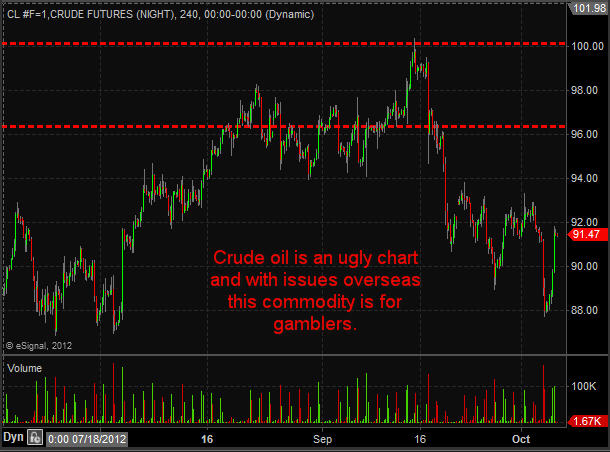
Crude oil has had some large price swings this year and another one may be on its way. This report shows the seasonality of crude oil along with where oil is trading and what the oil service stocks are telling us is likely to happen going into year end.

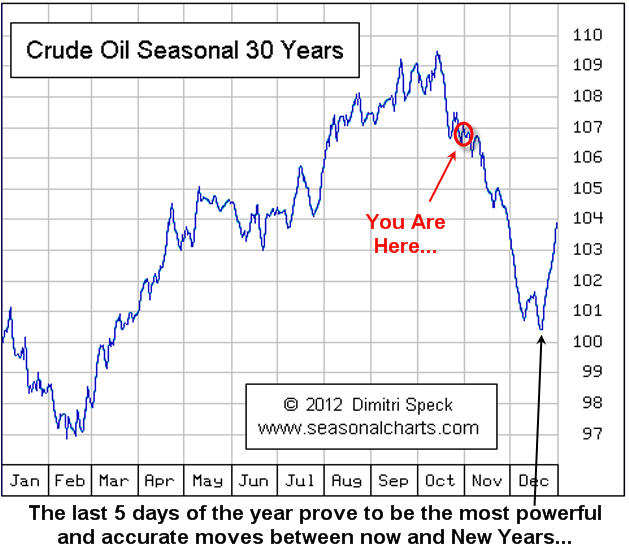
Since WTI Crude Oil topped out in September at the $100 resistance level (Century Number) many traders are looking for a bounce or bottom to form in the next week. Historical charts show that on average the price of oil falls during November and the first half of December.

The charts of oil and oil stocks shown below have formed patterns on both time frames (weekly & daily) that lower prices are to be expected. If you did not read my Gold Seasonality Report I just posted be sure to review it here: Gold Seasonal Report

Crude Seasonality

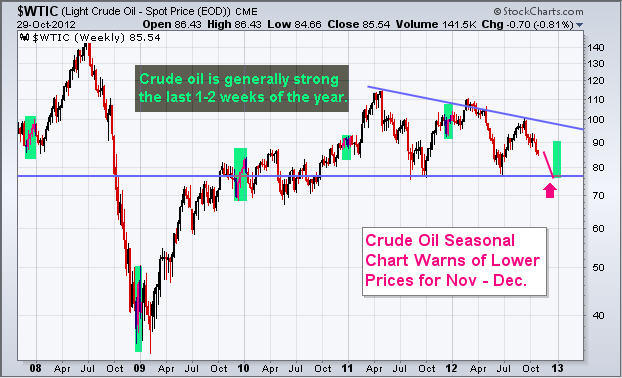
WTI Crude Oil Weekly Chart:

Here you can see that price tends to fall going into Christmas and rallies during the last week of trading. This price action falls in line with Dimitri Specks seasonal chart providing us with insight as to what we should expect. Later this week I will finish my report on the Election Cycle Seasonality report which shows weakness in the market during Oct & Nov when a president is up for re-election.

Crude Oil Price

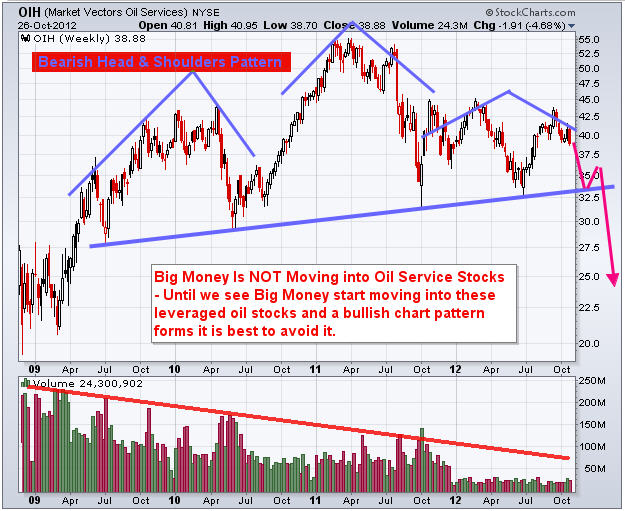
Oil Services Stocks – Weekly Chart:

If you follow oil closely then you know likely know already that oil related stocks can lead the price of oil by a couple weeks. What this means is that if big money is flowing into oil stocks (bullish price patterns with strong volume), then you should expect the price of crude oil to rise in the coming days. That said, if money is flowing OUT of oils stocks then lower or sideways oil price should be expected.

The weekly chart oil stocks show a very large bearish head & shoulders pattern. While I do not think the neckline will be broken it is very possible.

One of the most important pieces of data on the chart is the VOLUME. Notice the lack of it… Volume tells us how much interest and power is behind chart patterns and declining volume clearly tells us these investments are out of favor currently and that big money is not moving into them.

Oil Stocks Weekly

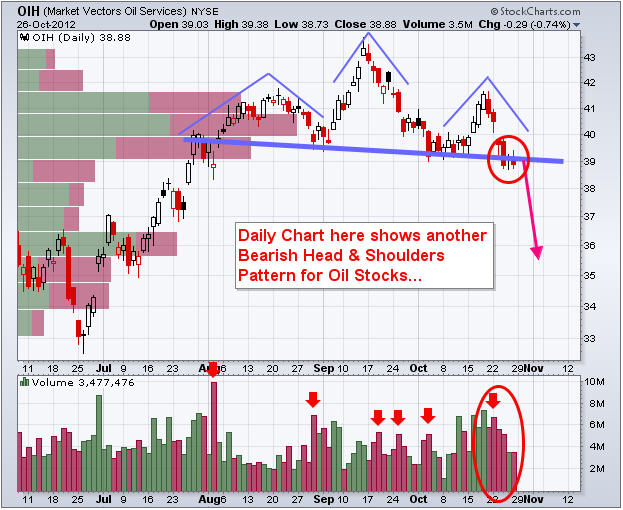
Oil Services Stocks – DAILY Chart:

Zooming into the daily chart of the oil service stocks we can see there is yet another bearish pattern unfolding. Another head & shoulders pattern which looks as though it is just starting to breakdown as of this writing. Next support level is $35-36.

Crude Oil Stocks Daily

WTI Crude Oil and Oil Service Stocks Trading Conclusion:

Looking forward 1-2 months (November – December) taking the seasonal price swings in oil, re-election cycle seasonality and price action of oil stocks I feel oil will trade sideways or down from here. With that being said, expect crude oil to rally during the last week of the year. I hope this provides some useful info for your trading!

Get my Daily Trading Analysis & Trade Setups at: www.TheGoldAndOilGuy.com


 Chris Vermeulen Chris Vermeulen is Founder of the popular trading analysis website www.TheGoldAndOilGuy.com. There he shares his highly successful, low-risk trade ideas. Since 2001 Chris has been a leader in teaching others to skillfully trade Currencies, Stock Indices, Bonds, Metals, Energies, Commodities, and Exchange Traded Funds. Reach Chris at: Chris[at]TheTechnicalTraders.com


Disclaimer:
This material should not be considered investment advice. Technical Traders Ltd. and its staff are not a registered investment advisors. Under no circumstances should any content from this website, articles, videos, seminars or emails from Technical Traders Ltd. or its affiliates be used or interpreted as a recommendation to buy or sell any type of security or commodity contract.
Our advice is not tailored to the needs of any subscriber so go talk with your investment advisor before making trading decisions This information is for educational purposes only.

By: Chris Vermeulen – www.TheGoldAndOilGuy.com

If you own physical gold, gold mining stocks or plan on buying anything related to precious metals before year end, you are likely going to get excited because of what my analysis and outlook shows.

Since gold topped abruptly a year ago (Sept 2011) with a massive wave of selling which sent the price of gold from $1920 down to $1535, technical analysts knew that type of damage which had be done to the chart pattern could take a year or more to stabilize before gold would be able to continue higher.

Fast forwarding twelve months to today (Oct 2012). You can see that gold looks to have stabilized and is building a basing pattern (launch pad) for another major rally. The charts illustrated below show my big picture analysis, thoughts and investment idea.

Weekly Spot Gold Chart:

The weekly chart can be a very powerful tool for understanding the overall trend. This chart clearly shows the last major correction and basing pattern in gold back in 2008 – 2009. Right now gold looks to be forming a very similar pattern.

Keep in mind this is a weekly chart and if you compare the 2009 basing pattern to where we are today I still feel it could take 3 – 6 months before gold truly breaks out to the upside and kicks into high gear. The point of this chart is to provide a rough guide for what to expect in the coming weeks and months.

Gold Stock Investing

Weekly Chart of Junior Gold Miner Stocks:

If you follow gold closely then you likely already know junior gold mining stocks can lead the price of gold up to two weeks. Meaning gold mining stocks which you can track by looking at GDX and GDXJ exchange traded funds will form strong bullish chart patterns and generally start moving up in price before physical gold.

The chart below shows the junior gold miner ETF with a VERY BULLISH chart and volume pattern. Remember that gold stocks are a leveraged play on gold in most cases. For example, if gold moves up 1% we typically see GDX and GDXJ move 2-4%. Because they act as a leveraged play on physical gold smart money and big institutions start accumulating these investments in anticipation of gold rising.

GDXJ has formed a tight bull flag and the volume levels confirm there is big money moving into these investments. The first price target on GDXJ using technical analysis for a measured move points to the $32 area. Looking forward twelve months with gold trading above $2000 we could see this fund more than double in value.

Bonus: while most traders focus on GDX gold miner fund, I prefer the GDXJ fund because its almost identical in price performance BUT it pays you a 5% dividend…

Junior Gold Mining Stocks

Gold’s Seasonality:

It’s that time of year again where gold tends to move higher. Below you can see where we are and what the price of gold typically does in November.

Gold Seasonality Trading

Gold Investing & Trading Conclusion:

Looking forward one month (November) and factoring in the recent pullback in gold to known support levels along with strong buying of junior gold mining stocks, I feel gold will take another run at the $1800 level and for GDXJ to test its previous higher of $25.50 at minimum. If both those levels get taken out then a massive bull market for precious metals could be triggered. Only time will tell…

Get my Daily Trading Analysis & Trade Setups at: www.TheGoldAndOilGuy.com


Chris Vermeulen

Disclaimer:
This material should not be considered investment advice. Technical Traders Ltd. and its staff are not a registered investment advisors. Under no circumstances should any content from this website, articles, videos, seminars or emails from Technical Traders Ltd. or its affiliates be used or interpreted as a recommendation to buy or sell any type of security or commodity contract.
Our advice is not tailored to the needs of any subscriber so go talk with your investment advisor before making trading decisions This information is for educational purposes only.

The $1800 per ounce level continues to be a major technical resistance area for gold. After hovering near $1800 recently, gold moved sharply away from that level last week to close at $1735 an ounce.

Despite that, more fund managers and analysts continue to point to a bright long-term future for gold prices. John Hathaway of the Tocqueville Gold Fund says gold will reach new highs within a year. He based his forecast, like many others, on the fact that negative real interest rates look likely to persist as Ben Bernanke and the Federal Reserve continue to print money.

Believe it or not, some mainstream analysts are also touting gold’s potential. Merrill Lynch analysts point to the correlation (discussed in a previous article) between the price of gold and the expansion of the Federal Reserve’s balance sheet since the start of QE1 in early 2009.

Based on the current path of the Fed’s balance sheet expansion, Merrill Lynch came up with two longer-term targets for the price of gold. They project gold to hit $2,000 an ounce next summer and to hit $2,400 an ounce by the end of 2014.

Another way to look at gold and the Fed is the so-called gold coverage ratio. That is the amount of gold on deposit at the Federal Reserve versus the total money supply. According to Guggenheim Partners, the gold coverage ratio is at an all-time low of 17%. The historical average is about 40%, meaning that gold would to more than double to reach the average.

Looking at the Fed’s balance sheet is a new and interesting way to look at and forecast gold prices. In the past, the conventional wisdom was that gold was merely an anti-dollar play: U.S. dollar down, gold up and vice versa. But that seems to be changing…..

Reuters had some interesting data. The value of the U.S. dollar net short position fell to $6.43 billion for the week ended October 9. This is substantially down from the previous week’s net short position of $16.3 billion. At the same time, the “managed money” net long gold position in gold futures rose to its highest level since August 2011. That was the time when gold hit its record high of $1,920 an ounce.

So much for conventional wisdom. Both currency and gold traders are seeing this long-term relationship between gold and the U.S. dollar breaking down into a “new normal” of direct central bank intervention into financial markets. Gold seems increasingly to be turning into more of a safe haven play than an anti-dollar one. It seems that more investors are worried about all fiat currencies that are burdened by huge debt loads.


The Technical Take…

Below is a daily chart of gold futures. Looking at the price levels and analysis you can see that a bounce or bottom could form at any time now. Price of gold has pulled back in a mini five wave correction touching both our first Fibonacci retracement level of 38% and the 50 day simple moving average. This is the type of pullback that longer term investors like to add to their long gold position. While gold does have the potential to fall all the way down to $1625, in the long run it should continue to rise for the long term investor.

From a trader point of view, it may be worth a stab to get long gold with a very tight stop, but until we see a real panic selling day in gold where volume is high I don’t think the final bottom is in yet.

Spot Gold Bullion Investing

Chris Vermeulen

Despite the decline this past week, gold seems to be regaining favor with global investors, as just a week earlier it had been flirting with the $1,800 an ounce mark. Quite a change from the sentiment in early summer when some investors were questioning whether the yellow metal’s decade-long bull run was coming to a close.

The rebound in investor sentiment toward gold, of course, coincided with the launching of open-ended QE3 (or QE infinity) by the Federal Reserve. Since then gold has “barely paused for breath. It has, as discussed previously, touched all-time highs in terms of euros or Swiss francs.

QE3 certainly seemed to worry some investors. These people moving into gold are concerned about things such as competitive devaluations and the debasement of currencies in an attempt to pay back enormous debt loads with a cheaper currency. This road – currency debasement – eventually leads to inflation most believe.

So it is really is not surprising that, according to UBS, investors in exchange traded funds raised their holdings by 158 tons since the beginning of August to a record 2,681 tons of bullion recently.

Many of the world’s best investors are in agreement with the average person putting his or her money into gold. The list of names is impressive: George Soros, John Paulson, Ray Dalio and Bill Gross.

Ray Dalio, founder and chief investment officer of Bridgewater Associates – the world’s largest macro hedge fund, told CNBC viewers recently: “Gold should be part of everybody’s portfolio. We have a situation now when you have too much debt. Too much debt leads to the printing of money to make it easier to service. All of those things mean that some portion [of a portfolio] should be in gold.”

Dalio’s conclusion? “Only gold and real assets would survive.

All of this positive macro news about gold has managed to influence the gold chart too. According to asset manager Blackrock, “the gold chart has turned decidedly bullish.” Blackrock was speaking about the so-called “golden cross”. That occurs when the 50-day moving average moves above the 200-day moving average.

Blackrock noted that the last time gold’s chart looked so good was shortly after the Federal Reserve announced QE1, the first round of money printing. It said that if gold does the same thing it did back then, the price of the precious metal will hit $2,400 an ounce by next summer. Of course, macro factors like Chinese and Indian demand for physical gold will play a major role in whether we reach those lofty levels.

While I am bullish on gold longer term the chart patterns, volume and sentiment for both gold and silver are overwhelmingly bearish looking for the next couple weeks. I sharp pullback is likely to unfold before they take another run at resistance and breakout to new highs.

Gold Bull Market Investing

Chris Vermeulen

Bill Gross is one of the most recognizable names in the investment world. He is the founder and co-chief investment officer at bond fund giant PIMCO. His long-term track record regarding bonds is among the best and he still runs the world’s biggest bond fund, the PIMCO Total Return Fund.

Gross is also known for speaking quite bluntly about the United States’ growing debt problem. His latest monthly market commentary came with a warning for the U.S. and investors alike. Gross stated that a number of recent studies have concluded that “The U.S. balance sheet, its deficit and its ‘fiscal gap’ is in flames and that its fire department is apparently asleep at the station house.”

The recent studies Gross pointed to came from the Congressional Budget Office, the International Monetary Fund and the Bank of International Settlements. The studies calculated that the United States needs to cut spending or raise taxes by 11% of GDP over the next 5-10 years. This translates to $1.6 trillion per year. That compares to the country’s 8% of GDP deficit in 2011. Those numbers put the U.S. in the ‘ring of fire’ with other countries with similar fiscal gap sizes. These countries include Greece, Spain, Japan, France and the U.K.

Gross warned that the U.S. debt problems have put the country in this “ring of fire” that will burn most investors. The only investors who will not get “burned”? He says the lucky few will be those that are protected by gold and other real assets, protected from a severe U.S. dollar depreciation caused by the Federal Reserve’s money printing.

In a white paper titled “GOLD – The Simple Facts” posted on PIMCO’s website, PIMCO analysts Nicholas J. Johnson and Mihir P. Worah also said some interesting things. Here is an excerpt, “Our bottom line: given current valuations and central bank policies, we see gold as a compelling inflation hedge and store of value that is potentially superior to fiat currencies.” They pointed out the positive supply/demand characteristics of gold as a big plus in their scenario. The PIMCO analysts went on to say, “We believe investors should consider allocating gold and other precious metals to a diversified investment portfolio.”

That is quite a statement coming from a “mainstream” investment firm. Wall Street’s usual reaction to gold is that it is a barbarous relic whose only use is in jewelry and that no sane investor should put any money into it, even paper gold instruments such as gold ETFs like the SPDR Gold Shares (NYSE: GLD) and others.

After Bill Gross’ bullish words, gold prices were trading a 7-month high on Thursday before falling Friday to finish the week at about $1776.00 an ounce.

Gold Investing Newsletter

Chris Vermeulen

Over the past year we have had some really interesting things unfold in the market. Investing or even swing trading has been much more difficult because of all the wild economic data and daily headline news from all over the globe causing strong surges or sell offs almost every week.

For a while there you could not hold a position for more than a week without some type of news event moving the market enough to either push you deep in the money or get stopped out for a loss. This has unfortunately caused a lot of individuals to give up on trading which is not a good sign for the financial market as a whole.

The key to navigating stocks which everyone thinks are overbought is to trade small position sizes and focus on the shorter time frames like the 4 hour charts. This chart is my secret weapon and giving you both large price swings which daily chart traders focus on while also showing clear intraday patterns to spot reversals or continuation patterns with precise entry/exit points.

While I could ramble on about why the stock market is primed for major long term growth from this point forward I will keep things short and simple with some 4 hour and daily charts for you to see what I see and what I am thinking should unfold moving forward.

Keep in mind, the most accurate trading opportunities that happen week after week are the quick shifts in sentiment which only last 2-5 days at most which is what most of my charts below are focusing on…

Dollar Index – 4 Hour Chart

This chart shows a mini Head & Shoulders reversal pattern and likely target over the next five sessions. The dollar index has been driving the market for the past couple years so a lower dollar means higher stock and commodity prices.

Dollar Index Trading

Bond Futures – 4 Hour Chart

Money has been flowing into bonds for the past couple weeks with most traders and investors expecting a strong correction in stocks. As you can see the price of bonds hit resistance this week and as of Thursday has now started selling off. Money flowing out of this “Risk Off” asset means money will move to the “Risk On” investments like stocks and commodities.

Bond Futures Trading

Gold Futures – Daily Chart

Gold is stuck in both categories in my opinion. It is a “Risk Off” safe haven when people are scared of falling stock prices, and it is also a “Risk On” speculative investment when people are feeling good about the market. Gold has been trading at key resistance for a couple weeks and looks as though it’s starting its next rally.

Gold Futures Trading

Silver Futures – Daily Chart

Silver is in the same boat as gold though it carries much more volatility than gold. Expect 2-4% swings regularly and sloppy chart patterns in this metal.

Silver Futures Trading

SP500 Futures – Daily Chart

As much as everyone hates to buy stocks up at these lofty prices I hate to say it but I think they are going to keep going up and they could do this for a long time yet. If the dollar index continues to break down then I expect the SP500 to rally another 3% from here (1500) in the next 1-2 weeks.

SP500 Futures Trading

Crude Oil Futures – 4 Hour Chart

Crude oil has not had much attention from me in the past few months. While it has had big price action many of those big days took place on news causing an instant price movement making this extra dangerous to trade. I continue to watch rather than get attached to it.

Crude Oil Futures Trading

Natural Gas Futures – Daily Chart

Natural gas has been a great performer for us in the past 6 months as all the short positions slowly get covered. I just closed out my natural gas ETF trade this week with a 31.9% gain and plan on getting back in once the chart provides another low risk setup.

Natural Gas Futures Trading

Trading Conclusion:

In short, I feel the dollar index along with bonds will correct over the next few weeks. That will trigger buying in stocks and commodities. Keep in mind natural gas dances to its own drum beat. The dollar does not have much affect on its price and most times natural gas is doing the opposite of the broad market. Get My Pre-Market Trading Analysis Video and Intraday Chart Analysis EVERY DAY – www.TheGoldAndOilGuy.com

Chris Vermeulen

The price of gold hit a record high this past week . . . in euro terms (at about 1380 euros). The record came after a number of actions by central banks around the world, trying to stimulate their respective economies. The actions, usually centered around money printing, once again had investors looking for refuge in gold.

Since the beginning of September, investors have bought about 75 tons of gold through exchange traded funds. Reuters says that gold ETFs, such as the largest gold ETF – the SPDR Gold Shares (NYSE: GLD), are on track for their biggest quarterly inflows in over a year, of 3.285 million ounces. Finally, according to UBS, investors have also raised their bullish bets on gold futures to the highest level in more than a year.

All the world’s major central banks took action recently including the Bank of Japan which launched a fresh round of monetary stimulus. The main action though was centered in Europe and the United States. The European Central Bank has promised to buy an unlimited quantity of eurobonds going forward. And the Federal Reserve announced its third round of monetary stimulus, QE3, that promises to buy $40 billion of mortgage-backed securities monthly on top of its ongoing Operation Twist program of buying long-dated Treasuries.

Speaking about the monetary easing, Barclays precious metals analyst Suki Cooper put it this way to the Financial Times, “Gold finally found the catalyst it had been waiting for all year after the Fed announced open-ended quantitative easing.”

Another reason for gold’s rise in euro terms, it must be noted, is the continuing fiscal turmoil in Europe itself, particularly in Spain. Spain’s largest autonomous region, Catalonia, manages an economy as big as Portugal’s. The problem is that it has debts of 42 billion euros which it is struggling to service. Catalonia has requested a 5 billion euro temporary bailout from Spain’s central government, adding to its debt burden. In a real show of defiance, Catalonia is also refusing to implement austerity measures. Add to that, bank stress tests in Spain showed that the country’s 14 largest lenders will need 60 billion euros in new capital.

No surprise then that physical demand for gold bars and coins in Europe rose 15 percent in the second quarter, according to the World Gold Council!

Another positive fundamental reason in the corner of gold bulls is the recent currency appreciation in the Indian rupee. India is traditionally the world’s largest consumer of gold. Sales have been slow there this year due to the government trying to slow down gold sales there through rises in a gold import tax. However, the recent rise in the rupee has made gold purchases more palatable and gold sales to India have hit their highest level in two months.

So for now, many of the fundamentals look to favor a move higher for gold, although there is technical resistance at its 2012 high of $1791.

Know when to buy gold, silver, oil and stocks – www.TheGoldAndOilGuy.com

Chris Verneulen