Over the past couple of months, gold and silver have been uneventful. In this report I have posted weekly charts to show the larger trend of gold and silver. Also I have provided small charts of the US and Canadian gold stock funds GDX and XGD.

Because this report has weekly charts, which are a slow and dull time frame to follow, I have added another one of my Kitco Spot Gold Overlay trades, which is a short day trade to liven things up.

GLD ETF – Gold Bullion Price Action – Weekly Chart
I spoke with a few members last week, who wanted me to change my analysis for gold, which I agree with. So I would like to address this now to keep everyone on the same path.

In previous reports I have pointed out the reverse head & shoulders pattern in this weekly chart below. But to be honest, it is not a reverse head & shoulders, which everyone is saying it to be.

Why is gold not in a reverse H & S pattern? Because a reverse H & S pattern is just that, it means the price will reverse from the previous trend. A reverse H & S happens after a downtrend, which forms a bottom and the trend is not moving higher.

Gold has been moving higher, which you can see in 2007 and this large pattern is more like a Cup & Handle pattern – extremely bullish.
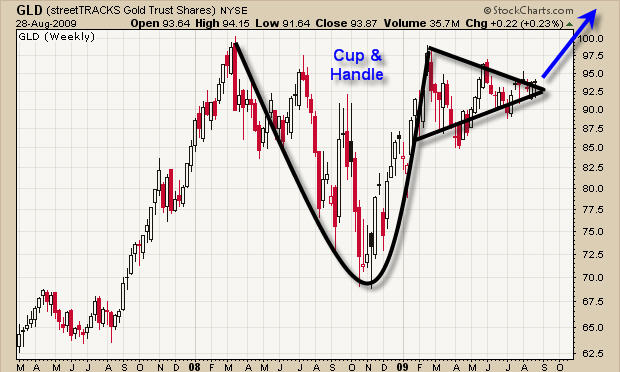
Trading Spot Gold Chart - Weekly

Trading Spot Gold Chart - Weekly

SLV ETF – Silver Bullion Price Action – Weekly Chart
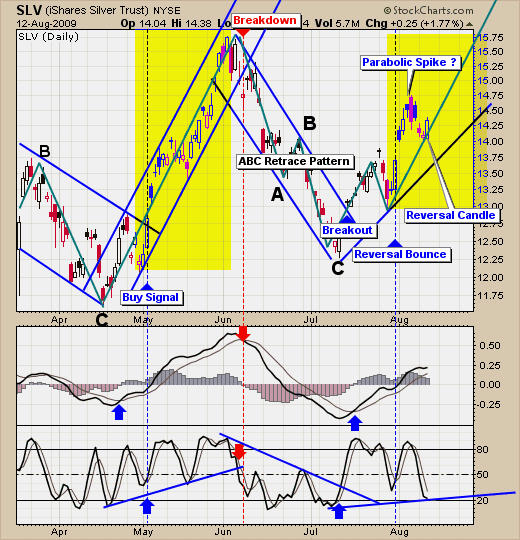
Silver is trading a little different than gold. As you can see the price is trading much lower than the 2008 high. There are also two small patterns forming, which are a small head and shoulders top or a bullish pennant.

Last Friday we saw gold and silver prices jump, but until we get a low risk entry point, I continue to watch these commodities move inside their large weekly price patterns.
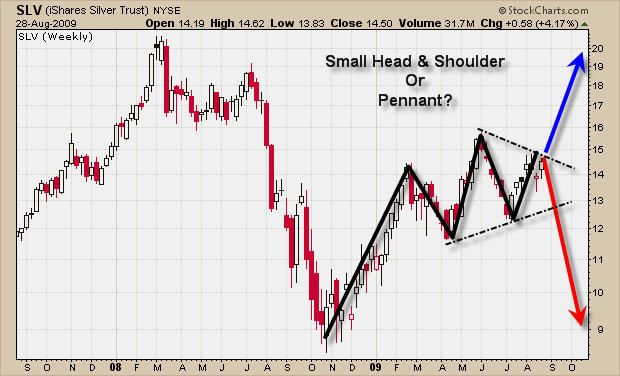
Spot Silver Chart - Weekly

Spot Silver Chart - Weekly

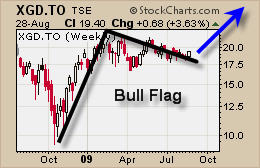
US & Canadian Gold Stock Funds
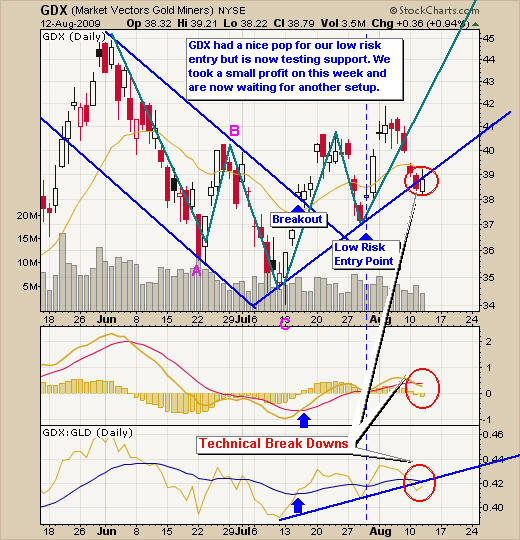
These small charts show how bullish the price action is this year for gold stocks. But the exciting part, which is tough to see here, is that the Canadian fund is starting to show bullish price action. When both the US and Canadian gold funds are moving together, it means there will most likely be some tradable moves in the near future. Let’s keep focused and ready to take action in the coming weeks, as these bull flags near the end of their cycle.
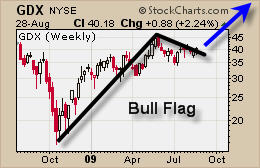
US Trading Gold Stocks
US Trading Gold Stocks


Canadian Trading Gold Stocks

Canadian Trading Gold Stocks

Day Trading Spot Gold – Day Trading GLD ETF
I will keep this short because I have written about this once before and below is the link to read my gold trading strategy in detail.

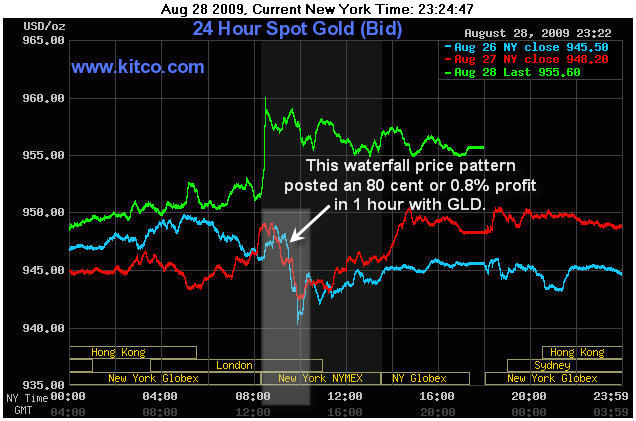
Day trading spot gold using the real-time kitco overlay chart is what I use to identify a possible day trade. The shaded box below shows a simple waterfall sell off and when I see that price action, I will generally take a position the next day around that time for a short trade in GLD.

I did not think to save this kitco chart until the following day so the waterfall price action was miniaturized because of Fridays rally. Also I would like to note this waterfall pattern happened 3 times in a row last week and I took advantage of them.

My Basic Strategy
Gold tends to move similar to what it did the previous day and traders know this, which is why the patterns starts 5-30 minutes earlier the following day, as we anticipate the move. Moves tend to repeat for up to 3 days. So you identify a sizable move and take action on it the following two days, as long as the rest of the day trades similar to the previous days. I like to scale into positions and once I see it going my way I add one final position to increase my exposure.

I am sure some of you are wondering how I traded GLD at 8am ET?
I trade with an online broker that allows me to trade pre-market and post market hours. Not very often these setups happen before 9:30am ET but last week it did.

Important note:
Once you see the price of gold making opposite moves of the previous day, minimize your position or don’t take the trade. As you can see in this chart below, the red line is starting to move the opposite way of the previous day (baby blue line) and later in the afternoon it was completely the opposite. This is a warning that there is a shift in the buyers/sellers and you can see the next day prices spiked higher in the opposite direction.
Day Trading Spot Gold - Day Trading GLD ETF

Day Trading Spot Gold - Day Trading GLD ETF

Read my previous Gold Day Trading Guide:
http://www.thegoldandoilguy.com/spot-gold-price-charts/

Technical Gold Trading Conclusion:
Overall precious metals are trending sideways in their bullish patterns and we are waiting for some low risk entry points.

During slow trading times, which we are currently in, I like to look for other profitable positions to satisfy my need to trade. As a full time trader, it is important to have a few styles of trading, which allow you to profit in any market condition. My main focus is on the commodity ETF’s, with low risk setups, but I also day trade GLD when opportunities arise and I also trade extremely over bought/oversold index plays using the leveraged ETF’s and focusing on my Active Trading Partners stocks trades, which provides profitable trades week after week. Combining these trading styles allow me to pull money from the market week after week without forcing any positions. I just let perfect setups unfold and I take advantage of them.

Soon I will be providing these gold day trades and index trades for members, which I think is very exciting. If you would like to receive my free weekly trading reports please visit my website at: www.GoldAndOilGuy.com

Chris Vermeulen

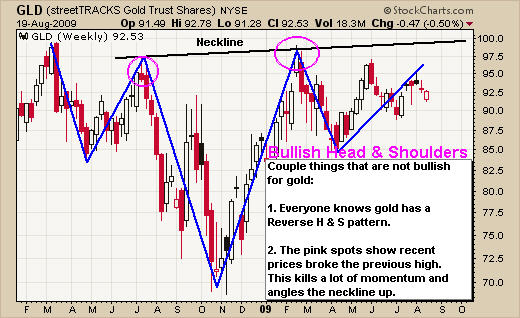
Everyone is talking about gold shooting to the moon because of the massive reverse head & shoulders pattern forming, not to mention the economy isn’t as good as some of us would like it to be?. I put together this quick report to show the bearish side of things for once.

Bearish Points for Gold & Silver:
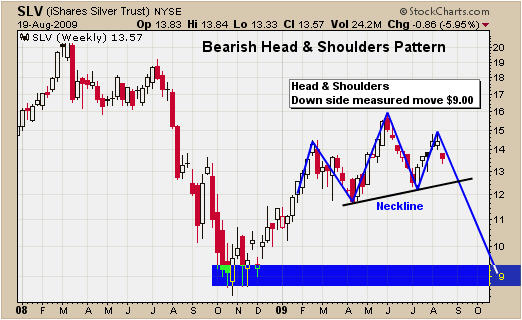
• Silver looks to be forming a H&S pattern
• Gold made a new high in March and quickly sold off
• Gold’s neckline is angled up which makes for a weaker breakout if it occurs
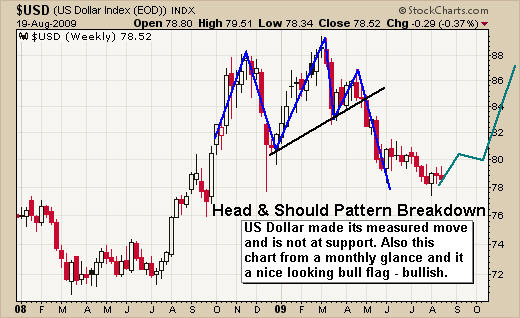
• The US Dollar looks ready for big rally.

SLV ETF – Weekly Chart
Silver is a great performer but we may have to start looking at shorting precious metals in the coming months if prices start breaking down.
1SilverHeadAndShoulders


GLD ETF – Weekly Chart

I like to be bullish on precious metals but these charts don’t provide much comfort. I will admit there are bunch of different ways to draw this gold chart which can make it look very bullish. But we cannot forget that the market will hurt the most individuals possible and we must be ready for these moves when they happen. Most traders think gold is going to breakout to the up side because of the economy and the famous Gold Reverse H&S pattern. But if everyone thinks this already wouldn’t everyone already be in gold? Who is going to buy gold to take it to the next level??

Also I want to point out that this reverse H&S has a neckline angled up which in my opinion is not a good sign. It shows the price was allowed to move above the previous pink high to suck in traders/investors as they panic to buy the breakout. Soon after buying gold they get taken to the cleaners as price plummeted. I just know from day trading that this type of head & shoulders pattern is not as accurate to trade and I avoid them (price patterns perform the same in all time frames).
2GoldHeadAndShoulders

US Dollar – Weekly Chart
Take a quick look at the US dollar. It formed a very nice H&S pattern and broke down to the measured move area quickly. Also this chart looks like a large bull flag and could start to move higher from this support level in the coming months. If this happens we will see precious metal prices drop.
3USDHeadAndShoulders

Technical Trader Conclusion:
The precious metals market is under pressure from the US dollar and some major resistance levels. Overall silver is underperforming gold and I look at silver as leading indicator. We are currently in cash waiting for a low risk setup for gold, silver, oil and natural gas.

If you would like to receive my free weekly trading newsletter please visit my site: www.GoldAndOilGuy.com

Chris Vermeulen
I hope everyone had a great weekend and is now ready for another week of trading. I have put together a few simple charts to show you what we could see with prices in the near term. While I do not predict future price movements (because it is impossible to always be correct), I do like to know what could happen and be ready to take action when something significant occurs.

The five charts below quickly summarize what I am seeing in the market currently.

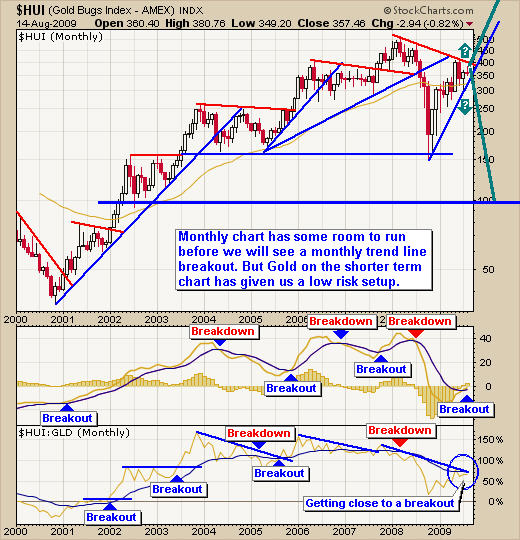
Gold Stocks – HUI Monthly Chart

Gold stocks have been performing very well this year. As you can see from the chart stocks are getting squeezed into the apex, which generally creates explosive moves. We could be months away according to this chart so don’t get trigger happy just yet.

A breakout to the upside will most likely trigger a very large rally. But if prices break down then I expect to see gold stocks pull back to new yearly low.

Gold Bullion Market

Gold Bullion Market

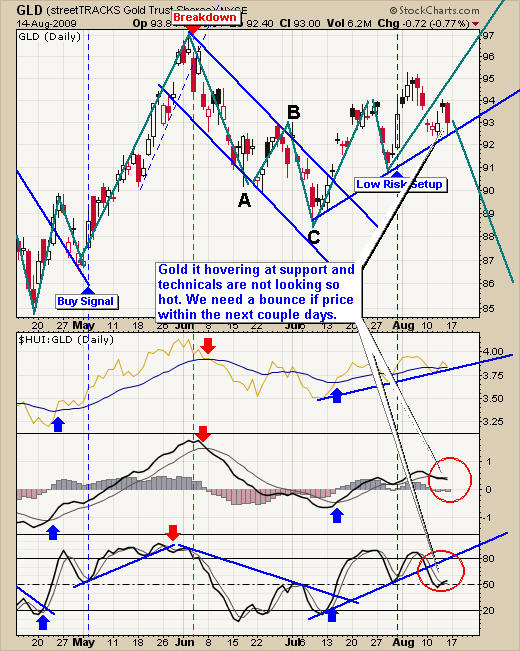
GLD Gold ETF – Gold Bullion Prices – Daily Chart

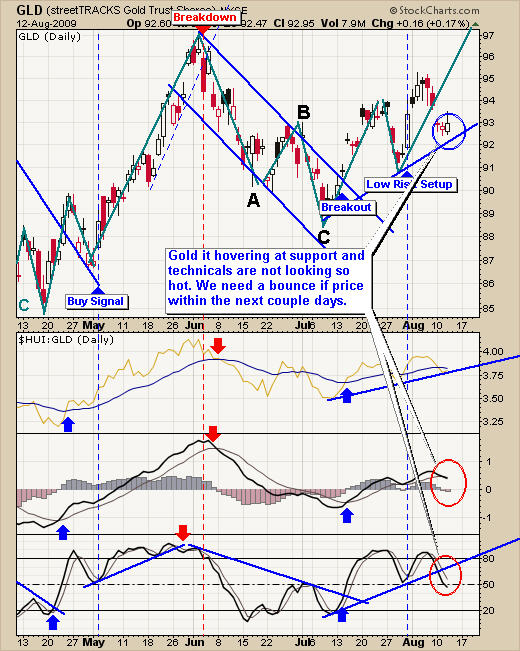
Gold has been trying to move higher the past 4 weeks and is having a tough time. With any luck gold will bounce higher Tuesday or Wednesday starting a new rally higher. If prices do not hold, up I figure we will see a sharp price drop which could go all the way back down to the $800 level within a couple months. I am currently long gold and will continue to hold it until I see a technical breakdown on the chart.

GLD ETF Trading Signals

GLD ETF Trading Signals

SLV Silver ETF – Silver Bullion Prices – Daily Chart

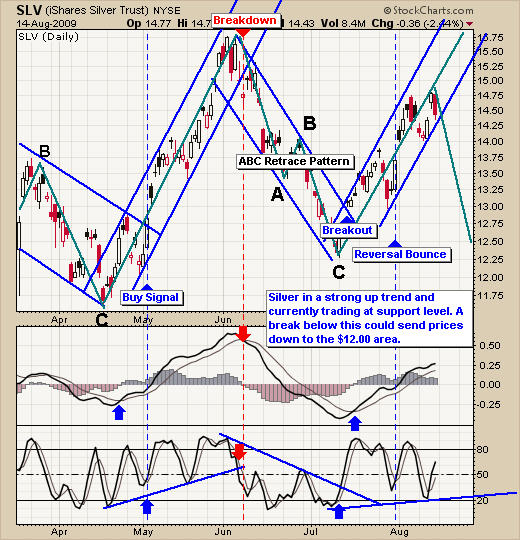
Silver is in the same situation as gol. It’s pointing to higher prices but a breakdown will most likely trigger a sharp sell off. I currently own silver and will be looking to exit below the $14.00 level.

SLV Silver ETF Trading Signal Newsletter

SLV Silver ETF Trading Signal Newsletter

UNG Natural Gas fund – Natural Gas Prices – Daily Chart

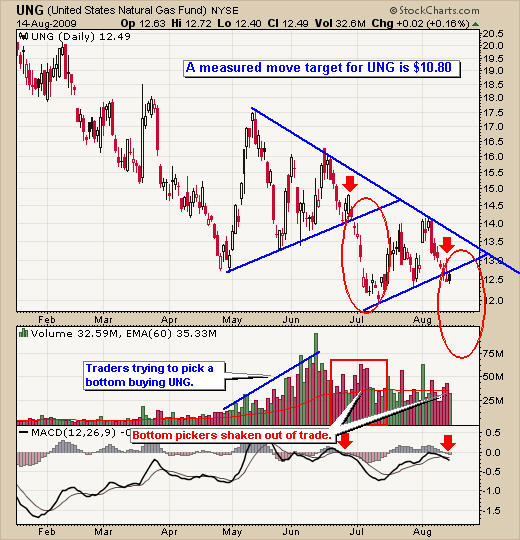
Nat Gas looks to be breaking down once again on rising volume. We could see another waterfall type drop this week.

UNG Fund Trading Signals

UNG Fund Trading Signals

USO Crude Oil Fund – Crude Oil Prices – Daily Chart

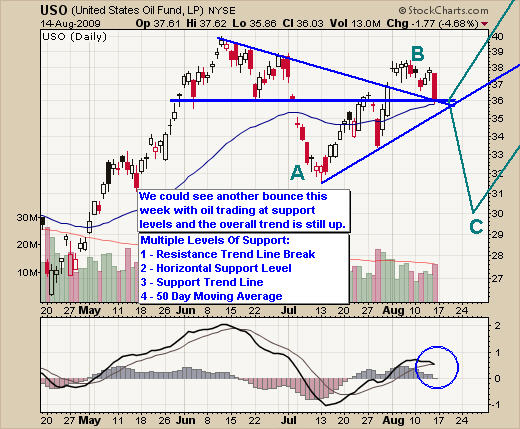
Crude oil had a big pullback Friday which could make for a great short term intraday play on Monday. Sharp price drops like this will generally have bargain hunters (buyers) step in the following day to push the price higher. Also I pointed out that oil is trading at 4 different support levels. This could give prices an intraday pop or possibly start a new leg higher in the coming days.

I continue to wait for a low risk setup in oil, which is possible that we get a setup this week. Only time will tell but I will keep you posted.

USO Crude Oil Fund Trading Signals

USO Crude Oil Fund Trading Signals

Technical Traders Conclusion:

Gold stocks, gold bullion and silver are trading at support levels. The overall trend is up so there is more of a chance that we will see a bounce from here. But the market always throws in a curve ball so be prepared for locking in gains or cutting losses quickly if we see prices slide lower.

Natural Gas continues to have selling pressure and looks to be having a technical breakdown as of last Friday. This could be a nice play for those aggressive traders who want to take advantage of a 1-3 day breakdown in price.

Light Crude Oil is in a similar situation as gold and silver. Currently trading at support and could go either way, but the odds are in favor for a bounce.

I will update again on Wednesday night, if you would like to receive these quick technical trading reports to your inbox Free please visit my website: www.GoldAndOilGuy.com .

Chris Vermeulen